Understanding Histograms in Digital Photography
A histogram is one of the most useful tools built into a digital camera, yet it is often misunderstood. It is not a miniature version of the photograph and does not judge whether an image is attractive. Instead, it provides a visual map of the tones recorded in a frame, from the darkest shadows to the brightest highlights.
Learning to read this graph gives photographers a more reliable way to evaluate exposure than relying on an LCD screen. Screen brightness, reflections, ambient light, and camera settings can all make a correctly exposed image appear too dark or too bright. The histogram reveals information that the display may hide.
A good understanding of tonal distribution also helps during RAW processing and photo editing. Once you know what the graph is showing, you can make more deliberate decisions about exposure compensation, highlight recovery, shadow detail, contrast, and color channels.
What a histogram actually shows
The horizontal axis represents brightness values. The left side contains black and near-black pixels, the middle contains midtones, and the right side contains white and near-white pixels. The vertical axis indicates how many pixels in the image fall within each tonal range. A tall section means many pixels share similar brightness values; a low section means fewer pixels occupy that range.
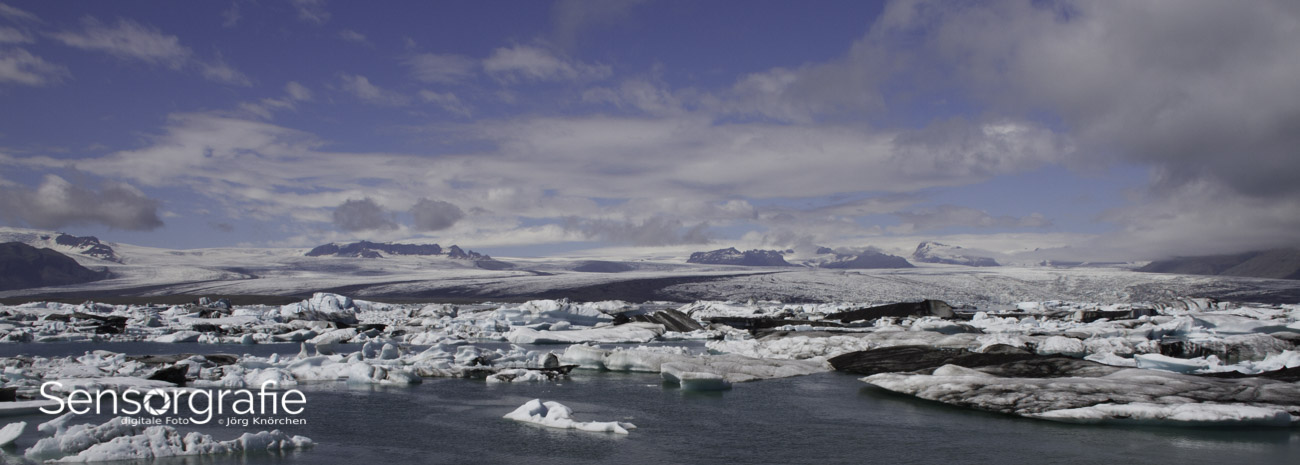
The shape changes according to the subject and the lighting. A low-key portrait photographed against a dark background may produce a graph concentrated on the left. A snowy landscape or a product shot against white may push much of the data toward the right. Neither pattern is automatically correct or incorrect.
What matters most is whether important information has been lost at either edge. When the graph touches or piles up against the far-left boundary, shadows may be clipped to pure black. When it presses against the far-right boundary, highlights may be clipped to pure white. Some images can tolerate clipped areas, such as a sun in the frame or deep, intentional shadows, but clipping on important subjects is usually difficult to repair.
How to interpret the shape
Many beginners expect a correctly exposed histogram to form a smooth mountain centered in the graph. This is a useful teaching image, but it is not a rule. A centered histogram may be wrong for a dark scene, while a graph weighted toward the right may be exactly right for a bright, high-key composition.
Start by considering the subject and the intended mood. In a night photograph, forcing the distribution toward the center can make the scene unnaturally bright. In a beach or snow scene, trying to prevent all right-side concentration can produce dull gray whites. Exposure should serve the scene rather than conform to a preferred graph shape.
A histogram with empty space on one side is also not automatically a problem. A scene may contain no deep shadows or no bright highlights. Look for unwanted contact with the boundaries, and examine the highlight warning or blinkies if your camera provides them. These warnings identify areas that may have reached the maximum recordable brightness.
The graph is most valuable when used with context. Check the image, identify the brightest important object, and ask whether its texture is preserved. Then inspect shadows and decide whether their detail matters. A histogram supports judgment; it does not replace it.
Reading luminance and RGB displays
Many cameras offer a luminance histogram, while others show separate red, green, and blue channels. A luminance graph estimates overall brightness and is usually the easiest starting point. However, it can hide clipping in an individual color channel, especially in strongly saturated subjects or colored lighting.
Imagine photographing a vivid red flower in bright sunlight. The overall luminance may appear safely within the graph, but the red channel could be pushed against the right edge. That means red detail may be missing even though the combined brightness looks acceptable. Channel clipping can create flat color and reduce the ability to adjust saturation naturally during processing.
RGB histograms are especially useful when photographing sunsets, stage lighting, neon signs, autumn foliage, and other high-saturation subjects. Watch for a channel that reaches the edge independently. If the affected area is important, reduce exposure slightly, change the angle, soften the light, or wait for better conditions.
The preview itself also matters. Picture styles, contrast settings, and white balance influence the JPEG preview and the histogram shown on many cameras. A RAW file may contain more recoverable information than the display suggests, but the histogram remains a practical warning system. Shooting RAW gives greater flexibility, not unlimited protection from overexposure.
Making exposure decisions in the field
The histogram becomes particularly valuable when the lighting is difficult or the subject cannot be reshot easily. Bright skies, reflective surfaces, backlighting, and artificial light can fool camera meters. By reviewing the graph after a test frame, you can adjust exposure before committing to a sequence.
For many RAW photographs, photographers use a technique often called exposing to the right, or ETTR. The idea is to record the image as brightly as possible without clipping important highlights. More data is generally captured in the brighter parts of a RAW file, and raising a shadow-heavy exposure in processing can introduce more noise than reducing a brighter one.
ETTR should be applied with care. It is not a command to make every frame visibly bright, and it is less practical when the light changes rapidly. Protecting highlights remains the priority, particularly in skin, white clothing, clouds, feathers, and reflective surfaces. A small amount of highlight clipping in an unimportant light source is very different from losing texture across a face.
| Histogram pattern |
What it may indicate |
Useful response |
| Data pressed against the left edge |
Shadow clipping or a naturally dark scene |
Check important shadow areas and add exposure if detail matters |
| Data pressed against the right edge |
Highlight clipping or a naturally bright scene |
Reduce exposure or protect key highlights |
| Broad distribution across most of the graph |
High contrast or extensive tonal range |
Check both edges and consider bracketing |
| Narrow central distribution |
Low contrast, flat light, or a limited-tone subject |
Expose normally and add contrast later if appropriate |
| Separate RGB channel touching an edge |
Color-channel clipping |
Reduce exposure, alter lighting, or reduce saturation |
| Several peaks and valleys |
Distinct subject tones or complex lighting |
Judge the meaningful areas rather than the overall shape |
Exposure compensation is often the fastest adjustment. If the highlights are blinking, dial in negative compensation and make another frame. If the graph is heavily left-weighted and important shadow detail is missing, use positive compensation. In manual exposure, change shutter speed, aperture, or ISO according to the creative effect and noise tolerance required.
For scenes with a very wide dynamic range, one exposure may not contain detail everywhere. Bracketing can provide several frames for blending, while graduated neutral-density filters can reduce the difference between sky and land. The histogram helps identify when the contrast exceeds the sensor's practical recording range.
This is useful in demanding subjects such as fireworks, where bright bursts appear against a dark sky. The fireworks camera settings guide offers a practical example of balancing intense highlights with a mostly dark frame. In such situations, the graph will not look conventionally balanced, so the photographer must protect the bright trails while accepting substantial dark background data.
Using histograms during photo editing
The histogram remains useful after capture. In applications such as Lightroom, Photoshop, Capture One, and other RAW editors, it shows how adjustments are changing the distribution of tones. Moving exposure, highlights, shadows, whites, and blacks can push pixels toward clipping, while curves and contrast adjustments can create new problems at the edges.
A RAW file often begins with a relatively restrained histogram. Increasing contrast expands the tonal range, while lifting shadows moves information away from the left side. Reducing highlights pulls bright data back from the right. These controls should be used while monitoring both the graph and the image, because a visually pleasing tonal distribution can still damage a specific color channel.
The histogram can also reveal why an edit feels harsh. If a curve adjustment creates tall piles at both extremes, the photograph may have lost subtle shadow and highlight transitions. This is particularly noticeable in portraits, architectural surfaces, and skies. A smoother distribution is not always necessary, but abrupt clipping should be intentional.
Keep in mind that a displayed histogram is based on the current color space, profile, and preview settings. A converted JPEG has less latitude than the original RAW file. When exporting for the web or printing, inspect the final version rather than relying only on the source image. Sharpening, saturation, and contrast changes can affect edge values during export.
Common mistakes to avoid
One frequent mistake is chasing a particular histogram shape. Photographers may brighten a naturally dark photograph simply because the graph sits on the left, or darken a snow scene because the data occupies the right side. The subject, lighting, and artistic intention should determine exposure.
Another mistake is trusting the histogram without checking the image. A graph can indicate that tones are technically present while important detail remains visually obscured. Conversely, a clipped sun or black background may be completely acceptable. Use the histogram to identify risk, then decide whether that risk affects the photograph.
It is also easy to confuse a peak with a problem. Peaks simply show that many pixels share a brightness value. A tall peak in the shadows might describe a large dark background, while a tall peak in the highlights might describe a white wall. The position and edge contact matter more than height alone.
Finally, remember that the histogram describes recorded pixels, not depth, sharpness, composition, or color accuracy by itself. It cannot tell you whether focus is correct or whether the subject has a compelling expression. It is one instrument in a larger evaluation process.
Habits that make histogram reading easier
Build histogram checks into the moments when exposure is most likely to fail: after changing from shade to sunlight, when photographing reflective objects, during sunrise and sunset, and whenever the scene contains extreme contrast. A quick review can prevent an entire sequence of unusable frames.
These practical habits make the graph faster to interpret:
- Enable the histogram and highlight warnings in the camera playback display.
- Check the RGB channels when photographing saturated colors or colored light.
- Judge clipping on important details rather than trying to preserve every pixel.
- Use exposure compensation or manual settings to correct the next frame immediately.
- Review the histogram again after major RAW adjustments and before exporting.
Practice with deliberately different scenes. Photograph a black object on a dark background, a white object on a bright background, a backlit subject, and a low-contrast scene in fog. Comparing the resulting graphs with the actual photographs will teach you more than memorizing an ideal pattern.
Photography workflows also benefit from understanding how cameras, editing software, and digital imaging tools interact. Sensorgraphy.net covers these subjects through photography articles, equipment and software reviews, galleries, and practical guides, making the photography resource a useful place to continue exploring the technical side of image-making.
The goal is not to make every histogram look perfect. The goal is to recognize what the tonal graph is telling you, protect the information that matters, and make exposure choices with confidence. Start checking it on your next shoot, compare it with the image on screen, and use the lesson from each frame to refine your process.